Everything you need to know about Google’s Core Web Vitals update (for SEO beginners)

In the world of SEO there has been a lot of talk recently about one thing, and unless you’ve been hiding in a cave… with the world’s best noise cancelling headphones… and a blanket over your head for good measure (and let’s be honest… there have been days over lockdown when that’s not sounded like such a bad idea!) it’s been pretty impossible to miss; and that’s the impending update to Google’s Core Web Vitals.
However, for most small business owners who have to wear multiple hats (SEO being just one of them) this important update may be something you’ve never even heard of… until now. Don’t worry, you’re not alone!
In a quick snap poll conducted today, 91% of small business owners in a national UK Facebook business group hadn’t heard of it either, and yet it’s potentially going to be something they will see impact (for good or bad) on their website ranking in Search Engine Results Pages (SERPs), and traffic over the coming months.
In this article we’ll take a closer look at what Core Web Vitals are, when the update is happening, and what the update means for you as small business website owners.
However, if you’re new to SEO, don’t worry; we’ve tried to keep this guide as simple and jargon-free as possible.
Note for any SEOs professionals:
This article is geared towards small business owners and SEO beginners so if you’re looking for some in-depth nitty gritty, this isn’t the article for you (Sorry!)
Contents
What are Google’s “Core Web Vitals”?
As a small business owner, even if you’re totally new to SEO, you may already know that Google takes into account lots of different factors when determining where to rank your website for a given search query.
In fact, Google uses over 200 ranking factors as part of their algorithm!
Core Web Vitals form a small, but important part of these.
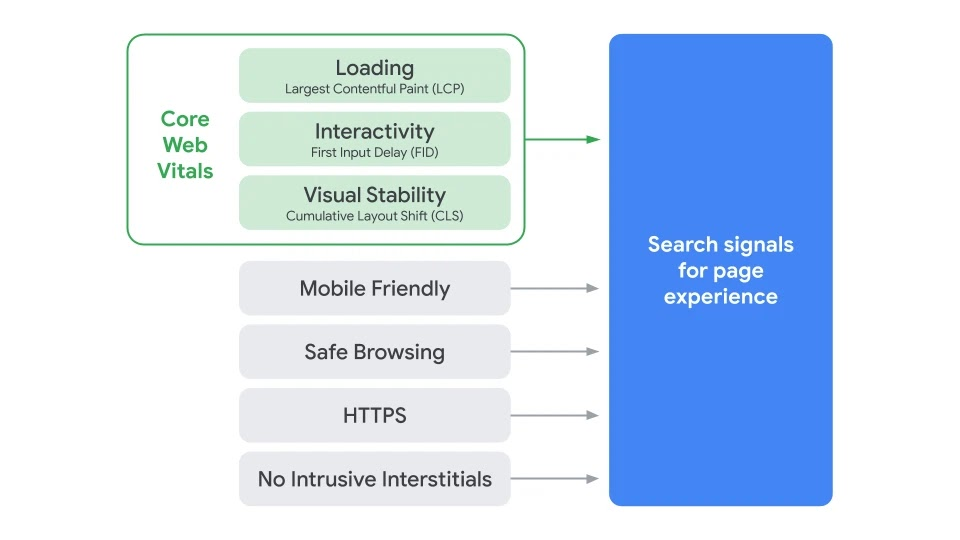
In May 2020, Google announced that a collection of metrics called “Page Experience signals” would become a factor in its ranking algorithm, and the “Core Web Vitals” metrics form part of those wider “Page Experience signals” as you can see in the diagram below:

[Source: Google Search Central]
Google’s Core Web Vitals are designed to provide Google with a more accurate measure of how users experience a website… your website… with a core focus being on 3 key areas:
* Notice how we’ve emphasised the importance of user experience? We’ll come back to that later!
Thankfully they have provided some useful benchmark metrics to help us understand and prepare for the update.
Introducing “LCP” - the loading speed metric
“93% of people have left because a website didn’t load quickly enough”
(source: hubspot.com).
Speed has always been an important part of Google’s ranking algorithm and that’s because Google’s core goal is to provide users with the single best answer to meet their needs, fast.
That’s why increasingly you’ll see examples where you don’t even need to leave Google for an answer. For example, ask Google what time it is in California and you’ll see an answer displayed within Google itself like this:

Gone are the days where you need to visit a separate timezone-conversion website.
When it comes to speed, Google actually captures and calculates multiple different metrics, but the one we’re most interested in today (and we’re going to have to drop in a couple of technical terms from this point on, but don’t worry, you can do this) is a metric called “Largest Contentful Paint” (LCP).
In simple terms, LCP is how long it takes to download and render the largest piece of content on a webpage, relative to when the page first started loading. The theory being, if the largest element on the page is super-fast, then other elements will be too.
Typically the largest element on the page will be either the “hero” image (you know the ones; they often appear full width and quite large at the top of a webpage) or a video. It can also be a large chunk of text if that’s larger than images, etc.
Keep in mind that it doesn’t measure the total time it takes for your page to load fully (there’s a different metric for that); it simply looks at when the most important part loads.
See, that wasn’t so scary was it?
Once you’ve identified which element is creating the largest LCP time, you can look to optimise it using a number of different techniques to make it load faster. Then a new item (which was previously 2nd largest) will become the new largest item, and you optimise that, and so on until you have a lightning fast website…. or that’s the theory at least!
How do I identify which element is the current LCP?
So, as touched on above, this is often an element such as your “hero” image or a video. However, that’s not always the case so how can you find out for sure?
Thankfully, Google has a lovely tool called Google’s PageSpeed Insight which gives you a whole host of valuable information including identifying the LCP for the page you’re testing. Nice!
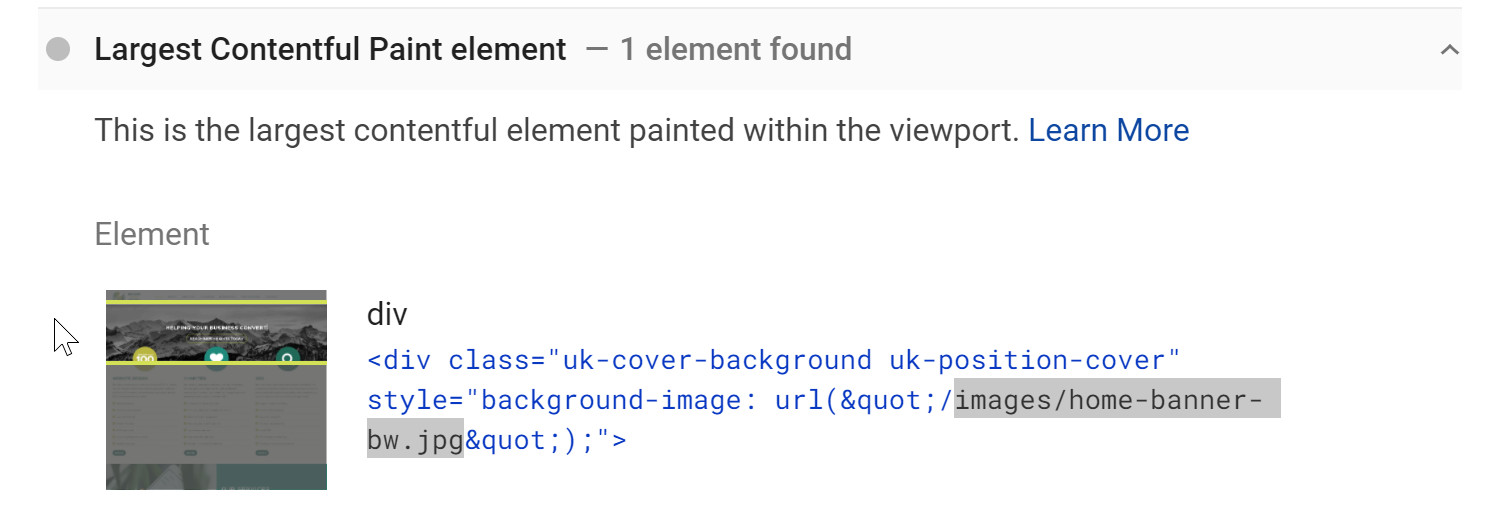
I’ll explain a bit more about the tool in the “How do I measure LCP speed” section below, but for the purpose of this section I’ll just say within that report all you need to do is scroll down to the “Diagnostics” section, locate the text “Largest Contentful Paint element” and click the small arrow to the right to reveal more information. This will reveal which image Google currently regards as the LCP element. Simple.

In this example:
- The code snippet Google displays tells us that it has determined the background image as being the LCP (Note: This can change! However, it’s a good guide)
- As we give our images meaningful names, we can quickly identify that it is the black and white background image of the mountains (Some automated tools generated non-logical filenames such as “38u88d.jpg”, which can make it slower to understand the image that it is referring to)
- Notice how Google shows the whole page as a screen-grab image and tries to highlight the relevant element for you. You can even click the image Google provides to zoom in for a clearer view.
What LCP score should I be aiming for?
It is traditionally accepted that 2 seconds is a good load time to be aiming for.
As far as LCP is concerned, Google have said:
“To provide a good user experience, sites should strive to have a Largest Contentful Paint of 2.5 seconds or less. To ensure you're hitting this target for most of your users, a good threshold to measure is the 75th percentile of page loads, segmented across mobile and desktop devices.”
In the diagram below you can see Google have set the following benchmarks for LCP:
- Good = Faster than 2.5 seconds
- Needs Improvement = 2.5 to 4 seconds
- Poor = 4 seconds or more

[Source: web.dev]
How do I measure LCP speed?
OK; As the aim of this article is to keep things really simple, I’m going to avoid going into this area in too much detail as I could easily write multiple articles on speed testing alone!
However, there’s little point having this article if you can’t at least run your own test, so a very simple way to get you started would be to visit Google’s PageSpeed Insight tool.
It’s dead easy to use.
- https://developers.google.com/speed/pagespeed/insights/
- Enter your full website address including the https:// part.
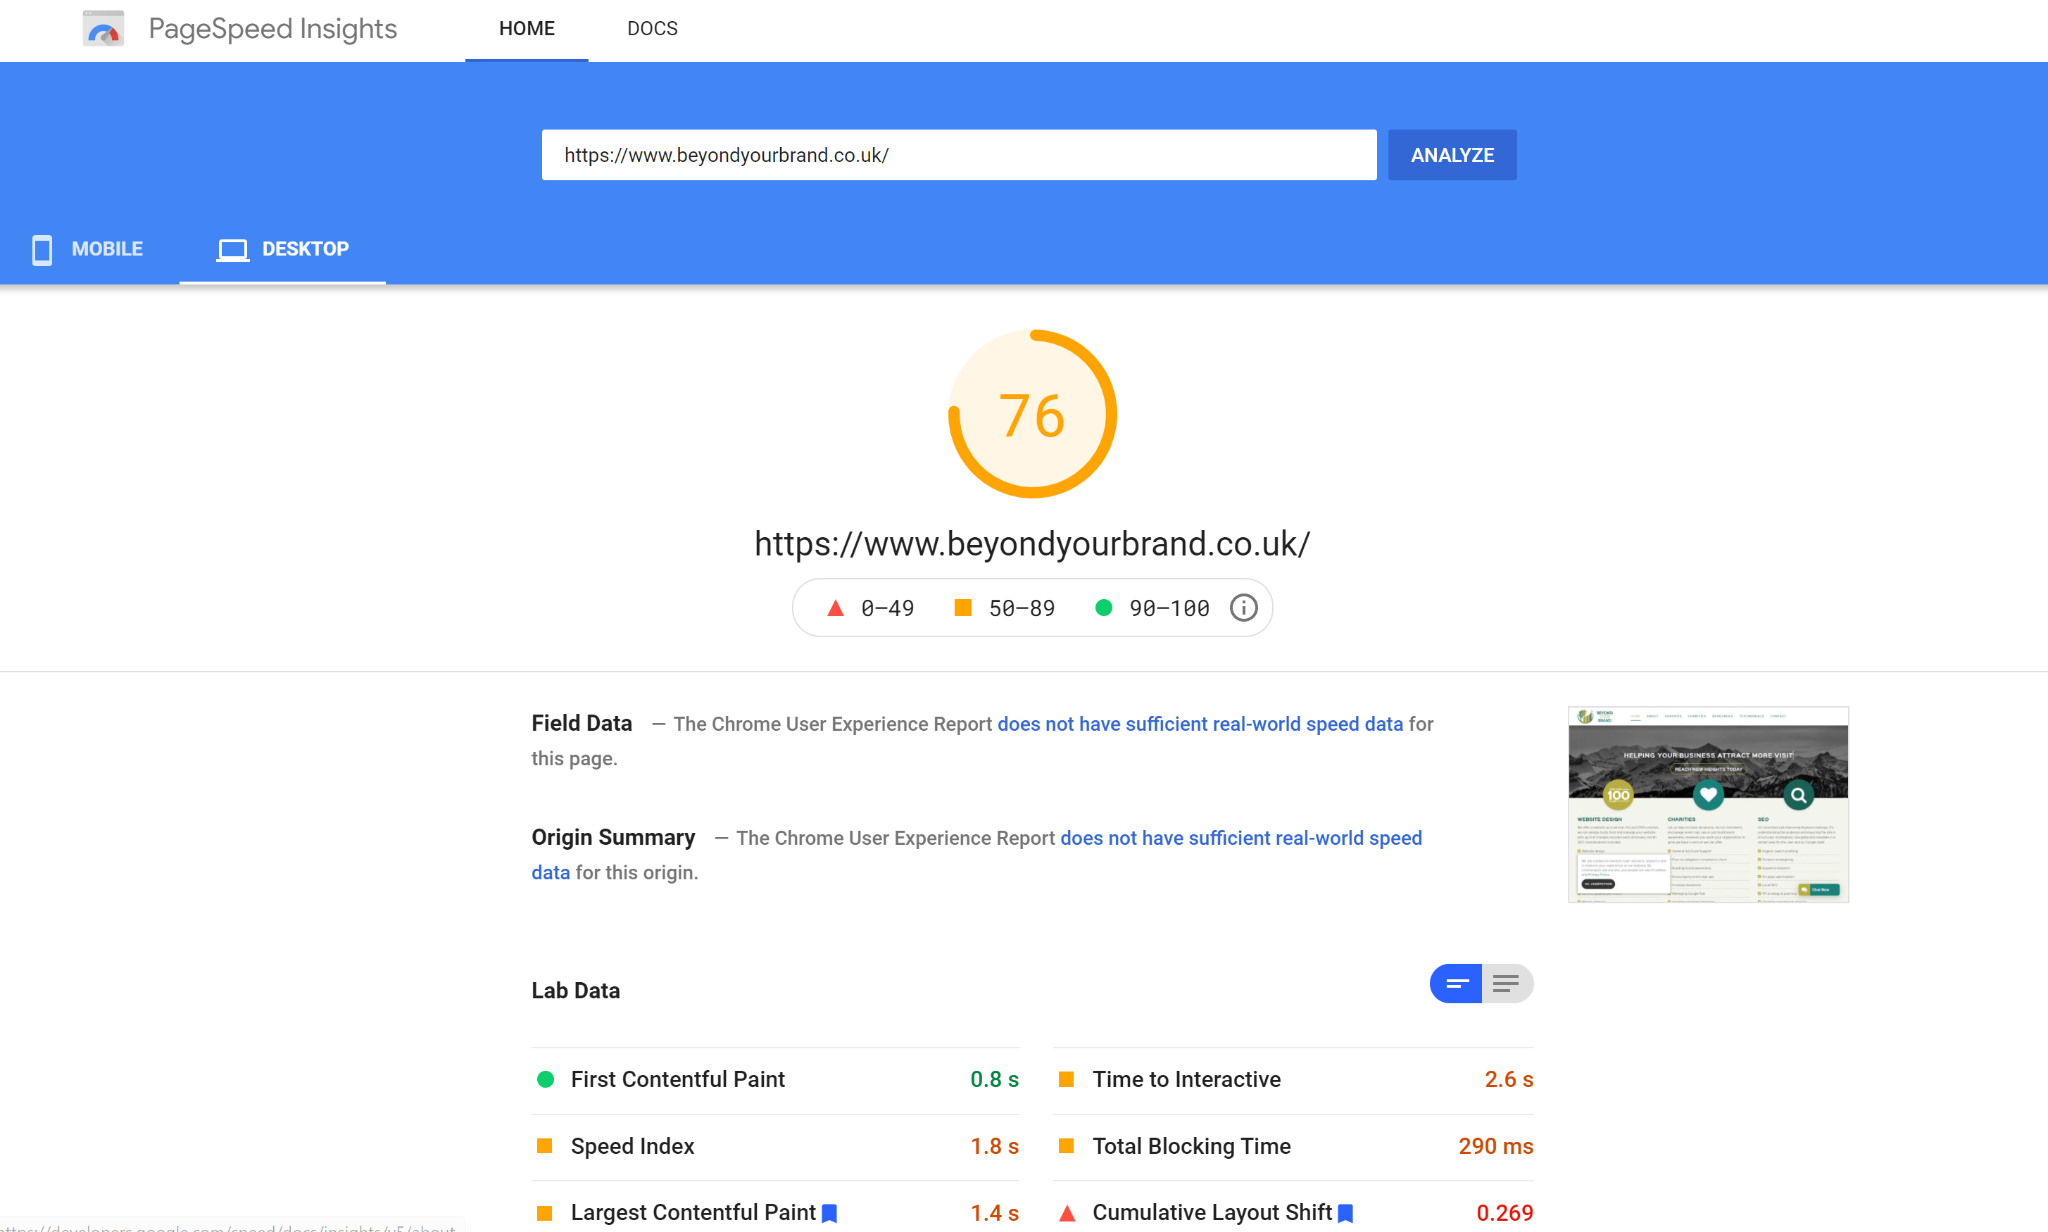
(Note: If your URL still start’s http and not https,This email address is being protected from spambots. You need JavaScript enabled to view it. as https is really important these days so we can have a chat with you in more detail.) - You’ll then see a report which either looks like this:

Or if there’s enough “field data”, the newer version which looks like this:

As you can see both of those reports provide a “Largest Contentful Paint” score.
The latter shows a more useful metric as it essentially says “of all the visitors we could measure data for over the past 28 days, 94% had a great speed experience of less than 2.5s, 4% of visits had a slightly less good experience of 2.5s to 4s, and the remaining 2% didn’t necessarily have a great experience as the LCP was longer than 4s.”
What’s really important to remember here is that Google is realistic in that it’s unlikely any website will ever be 100% green (even their own as seen above). Remember, they’re trying to ensure 75% or more of your visitors have a good experience.
A few things to note:
- Page speed is different for every page,
- Page speed and the scores you receive will be different for “desktop” vs “mobile” speed tests. Google now uses “mobile first indexing” so this is the area you want to focus on (even though I bet your score will be poorer in that area. Don’t worry - that’s currently normal for most sites, so you’re not alone).
- To make things more complicated, speed test results can literally change from test to test; even if you run the exact same test seconds apart. That’s because speed tests can be impacted by server loads, internet connection speed, the testing tool used, and many other factors. As a result, what you’re looking for here is to use speed test data as a guide only to identify any significant issues or changes. (We typically run nine speed tests at a time using a tool such as “WebPageTest”, identify any common issues, implement changes, and then re-test and measure changes over time. This ensures we’re not chasing the data but using it in a more informed and calculated way).
- You can get misleading results (We’ll come to that later with an example using the BBC website)
If you’re familiar with Google Search Console you may notice it also has a new Core Web Vitals graph under the “Experience” section, but so far we have found it’s less useful than the above and the data has been inconsistent between reports so we’ll hold off adding information about that aspect for the time being.
Introducing “FID” - the Interactivity metric
It’s actually possible to make a website that users can interact with whilst the website is still loading. Pretty cool right?
Google loves this as it means users don’t have to wait until everything has been downloaded (remember what we said above about Google loving speed?).
Similarly, don’t you just hate it when you click a button and then nothing seems to happen for ages? Quite often this can be because there are still elements downloading or scripts running in the background so your action has to wait.
This “delay” really can have a negative impact on user experience and whilst it can be caused by lots of different factors (server response times, slow device due to memory issues, slow internet speeds, etc.), FID aims to look at one very specific area.
There are two main metrics which go hand-in-hand to measure interactivity:
- “Time to Interactive” (TTI), and
- “First Input Delay” (FID).
Simply put:
- TTI
- measures the time until you can interact with a page
- can be calculated even if a user hasn’t actually interacted with the page yet
- is measured in seconds, and
- FID
- subsequently measures the time (delay) from when a user first interacts with a page* (i.e. when they click a link, tap on a button, or press a key) to the time when the browser is actually able to begin processing a response to that interaction.
- requires a user to interact with the page
- is measured in milliseconds.
It’s FID which is the focus of the Core Web Vitals update, and it’s scored as follows:
- Good = Less than 100ms
- Needs Improvement = 100 to 300ms
- Poor = 300ms or more

[Source: web.dev]
(* Just to get a bit technical for a moment, FID only takes into account distinct actions (i.e. clicking a link has a single, set, specific behaviour associated with it. Click a link to a “homepage” and you know it WILL take you to the homepage) as opposed to actions such as scrolling, pinch zooming, etc. which can vary (i.e. the user can scroll a little bit or a lot / fast or slow, etc.). FID doesn’t take into account these latter types of events.)
How do I measure FID speed?
OK, we’re going to cheat a little here as the simple answer is, if you’re new to SEO you don’t need to worry too much about FID. (That’s what we’re here for!)
That’s because the fixes required are all pretty technical in nature so you’re really going to want to get someone to do it for you.
However, if you’re curious and want to know how you measure up, then Google PageInsights can help with this too.
If your site gets enough traffic, then you may already see FID listed in your report as we saw above - for example:

However, what if you are still seeing the older style reports?
Google says (currently) PageSpeed Insight’s “Total Blocking Time” is the closest metric to FID; and that’s great if you’re an SEO professional looking to shave milliseconds off your times.
However, for small business owners, we’re going to go slightly against the grain here and recommend you actually look more at TTI.
Time To Interactive (TTI) and FID are very closely linked, and there are often larger gains to be had by improving TTI (Remember FID is milliseconds whereas TTI is seconds.) There’s no point trying to shave milliseconds off if your TTI is 12.3 seconds!

As long as both look healthy, that’s probably as detailed as you need to get for now. If either look like they’re presenting a significant issue,
Introducing “CLS” - the Visual Stability metric
Don’t you just hate it when you’re reading a page and all of a sudden everything seems to change position. You scroll down, find the bit you were reading and then everything shifts again! Yep, Google hates that too and that’s what they’re hoping to combat with a metric called “Content Layout Shift” (CLS)
It basically measures how many unexpected layout shifts occur during the entire lifetime of the page (i.e. not just whilst the page loads, but throughout the entire time you’re browsing that page in a visit).
The key word here is “unexpected”, as not all content shifts are bad. A common “expected” shift might be a “carousel” of images, or an expandable area of content as you often see used for FAQs to show/hide more information (we call them “accordions”).

We’re not going to get into how Google calculates CLS, as basically it involves a lot of maths (yuck) but let’s just say the result is that it gives you a mathematical score (i.e. it doesn’t use a unit of measure such as a %, seconds or milliseconds as with other metrics).
CLS is scored as follows:
- Good = Less than 0.1
- Needs Improvement = 0.25
- Poor = 0.25 or more
When is the Core Web Vitals update happening?
Google originally announced that Core Web Vitals will become ranking signals in May 2021. However, a recent update a few days ago (19th April 2021) on Google Search Central said:
“The first page experience update will start gradually rolling out in mid-June 2021, and will be complete by the end of August 2021”
That’s only a few weeks until Core Web Vitals come into effect, so now would be a great time to ensure you’re ready.
How will page experience affect ranking?
Google themselves have answered this nicely for us as follows:
"Page experience will join the hundreds of signals that Google considers when generating Search results.
While page experience is important, Google still seeks to rank pages with the best information overall, even if the page experience is subpar. Great page experience doesn't override having great page content. However, in cases where there are many pages that may be similar in relevance, page experience can be much more important for visibility in Search."
Ultimately, one thing has always remained true; “Content is King”.
So does that mean I don’t need to do anything?
No; but equally you shouldn’t lose any sleep over it. (That’s what we’re here for!)
For most small business owners, our top advice would always be to focus on creating amazing content and slick user experiences for your users. Get this bit right, and you won’t go far wrong as ultimately that’s what Google is (and always has been) looking for.
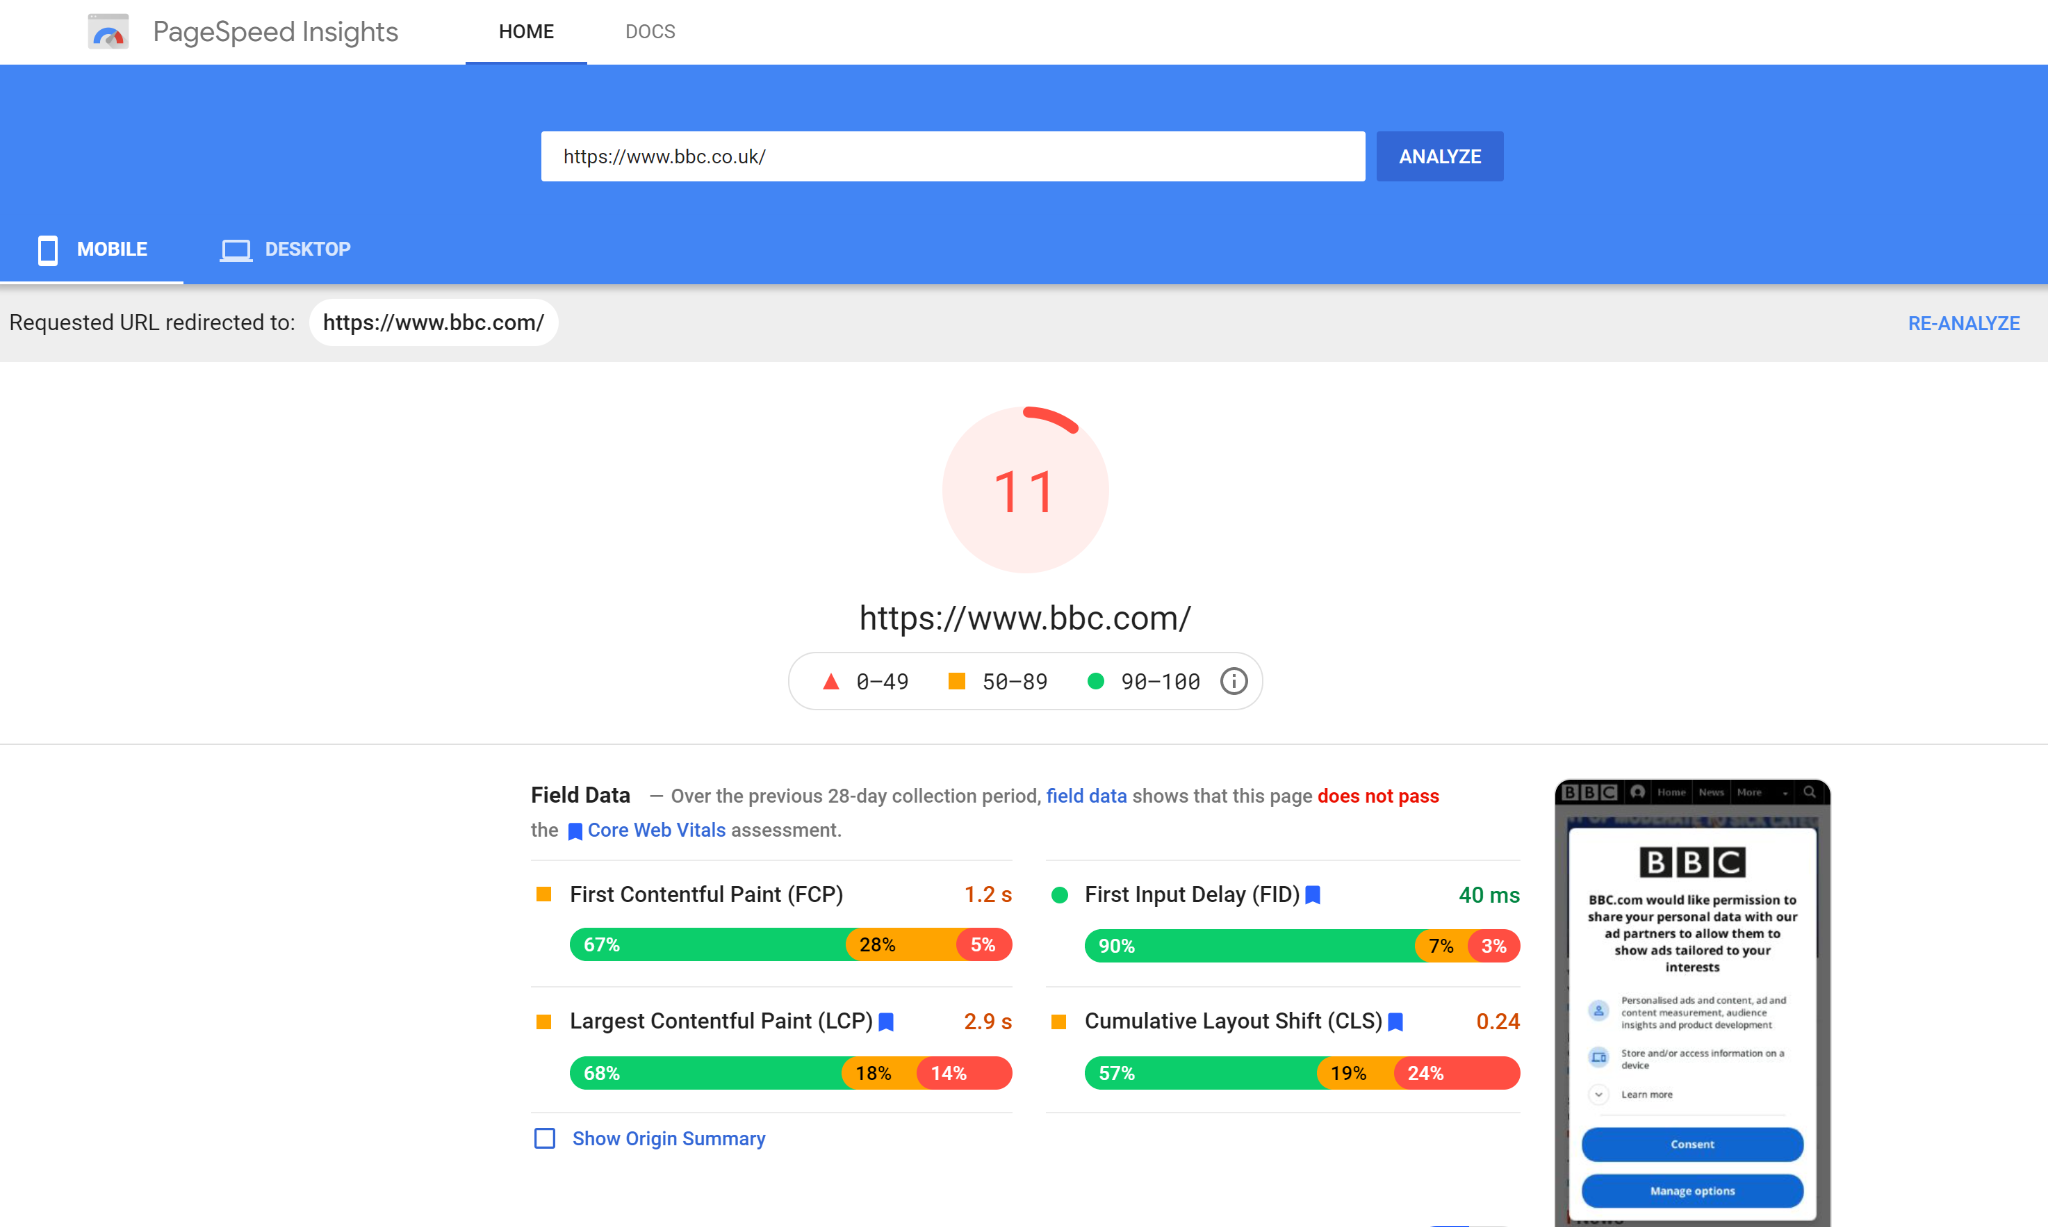
Nothing quite demonstrates this as clearly as the image below.

The BBC website at first glance scores really badly overall and yet as you can imagine, it scores highly in SERPs for news articles and is the “go to” news site for many people. Why? Because they’re trusted and allow people to find the content they’re looking for quickly and easily.
* Note: The eagle-eyed amongst you will notice despite me entering www.bbc.co.uk, PageSpeed Insights redirected the test to the www.bbc.com site. I won’t go into why, but the point is, don’t fall into the trap of chasing scores alone.
One final point to note…
Google are reported to be working on new labels which could appear within SERPs, to indicate which results have met all of the criteria listed.
A study by Search Engine Journal in August 2020 showed that less than 15% of websites meet the Core Web Vitals benchmarks. All things being equal, that extra visual clue could potentially make your result stand out above others on the same page thus potentially increasing clicks even if you have a lower position overall.
As a result, now could be a good time to use that to your advantage if at all possible.
Want to know more? Contact us for a friendly, no obligation chat about how we can look after your SEO so you don’t have to!
-
SEO for Plumbers: Top Tips to Beat Your Competitors Online
-
How to Get More Google Reviews for Your Business in 2025
-
What Is Google AI Mode, and What Does It Mean for SEO?
-
Performance Max for Google Ad Grants
-
SEO for Therapist Practices: Strategies to Attract Your Ideal Clients
-
SEO for Travel Agencies: 7 Top Tips to Increase Bookings
-
SEO for Small Businesses: 9 Top Tips to Capture & Convert the Right Customers
-
PPC For Small Businesses: Tips and Techniques to Improve ROI